Understanding the Importance of Moving Averages
In today’s dynamic financial market, data analysis is crucial in making informed trading and investment decisions. One powerful tool that traders and investors rely on is moving averages.
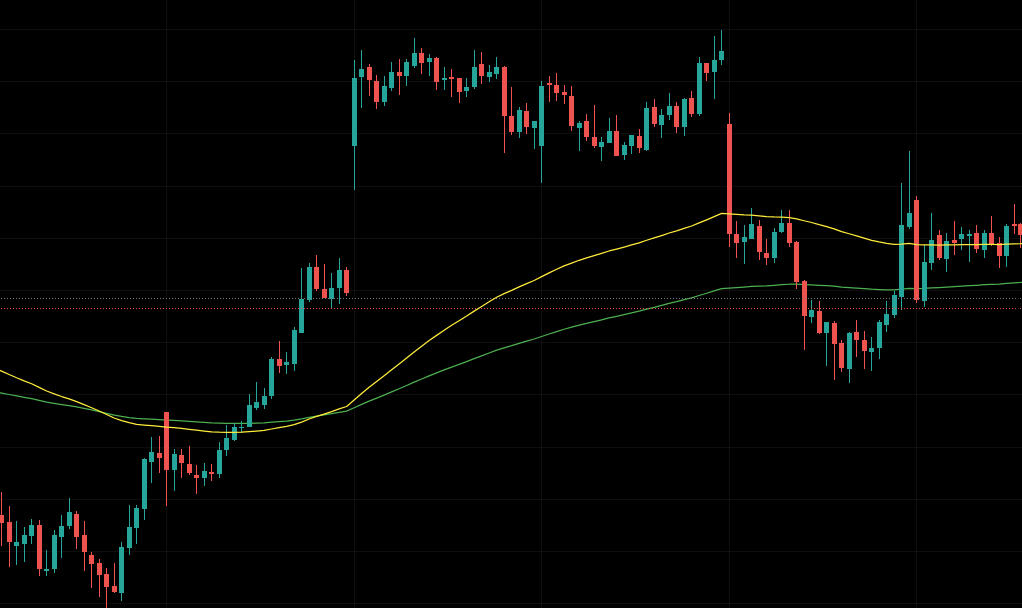
Moving averages provide valuable insights into market trends, support and resistance levels, price crossovers, and volatility.
In this blog post, we will explore the significance of moving averages, types, their formulas, and how they are calculated. Also, we will learn the benefits and limitations of using moving averages.
Must, Read | Moving Average Crossovers Can Double Your Trading Success
What are Moving Averages?

Moving averages are tools used to understand the general direction of a price trend. They analyze the average price of an asset over a specific time period, like a few days or weeks. By calculating this average, they help smooth out the ups and downs in the price data, making it easier to identify the overall trend.
There are different types of moving averages. The simple moving average (SMA) gives equal weight to each price point in the chosen time period.
The exponential moving average (EMA) places more emphasis on recent prices, giving them greater significance.
The weighted moving average (WMA) assigns different weights to different prices based on their importance.
Types of Moving Averages
Choosing the right type of moving average depends on your objectives and preferences. Let’s break down the three common types of moving averages in simple terms:
Simple Moving Average (SMA):
In simple terms, a Simple Moving Average (SMA) is a calculation that helps smooth out price fluctuations in a dataset over a specific period. It provides a clear and straightforward way to analyze the overall trend without giving more importance to recent prices. Let’s dive into the formula and calculation of SMA using an example:
Formula:
To calculate the Simple Moving Average, you need to follow these steps:
- Determine the time period you want to consider (e.g., 10 days, 20 days, etc.).
- Add up the closing prices of the asset for the chosen time period.
- Divide the total sum by the number of periods.
Calculation with an Example:
Let’s say we want to calculate the 10-day Simple Moving Average for a stock’s closing prices:
Closing prices over the 10-day period: $20, $22, $23, $21, $19, $20, $18, $19, $20, $21.
Step 1: Add up the closing prices:
$20 + $22 + $23 + $21 + $19 + $20 + $18 + $19 + $20 + $21 = $203.
Step 2: Divide the total sum by the number of periods:
$203 ÷ 10 = $20.3.
The 10-day Simple Moving Average of the stock’s closing prices is $20.3. This average value smoothes out the price fluctuations over the chosen 10-day period and gives you a better sense of the overall trend.
The advantage of using SMA is its simplicity and equal weighting of each data point. However, it’s important to note that because SMA gives equal weight to all prices, it may not reflect rapid changes in recent prices as much as other types of moving averages. This is why some traders and investors prefer exponential moving averages (EMA) or weighted moving averages (WMA) for more responsiveness to recent price movements.
Overall, SMA is a useful tool for analyzing trends and smoothing out price fluctuations, providing a clearer picture of the market’s overall direction over a specific time period.
Exponential Moving Average (EMA):
EMA, or Exponential Moving Average, is a type of moving average that focuses more on recent price changes. It reacts quickly to the most recent market movements, making it suitable for capturing and responding to price changes promptly. Let’s break it down in simpler terms with an easy-to-understand example.
Formula and Calculation:
To calculate the EMA, you need two things: the previous period’s EMA value (EMA<sub>n-1</sub>) and the current period’s closing price (CP<sub>n</sub>).
You also need to choose a smoothing factor, often represented as “α” or “weight” (a number between 0 and 1).
Here’s a step-by-step example to help you understand how EMA works:
- Let’s say we want to calculate the 5-period EMA for a series of closing prices: 10, 12, 15, 14, and 16.
- Choose a smoothing factor (α). For this example, let’s use α = 0.2.
- Start with the first closing price (10) as the initial EMA value: EMA<sub>0</sub> = 10.
- To calculate subsequent EMAs, follow these steps:
For the second period (n = 1):
- Take the difference between the current closing price (12) and the previous EMA (10).
- Multiply the difference by the smoothing factor (0.2).
- Add the result to the previous EMA: EMA<sub>1</sub> = (12 – 10) * 0.2 + 10 = 10.4.
For the third period (n = 2):
- Calculate the difference between the current closing price (15) and the previous EMA (10.4).
- Multiply the difference by the smoothing factor (0.2).
- Add the result to the previous EMA: EMA<sub>2</sub> = (15 – 10.4) * 0.2 + 10.4 = 11.32.
- Repeat these steps for the remaining periods until you have the desired EMA values.
In our example, the EMA gives more importance to recent closing prices, allowing it to respond quickly to price changes. Traders and investors often use EMA to track short-term price movements and generate timely trading signals.
Remember, the choice of the smoothing factor (α) affects the sensitivity of the EMA. Higher values make the EMA more responsive to recent prices, while lower values give greater weight to past prices, resulting in a smoother average. Adjust the smoothing factor based on your trading style and market conditions.
If you don’t have previous EMA values, you can start by using a simple moving average (SMA) for the first few periods until you have enough EMA values to work with.
To put it simply, when calculating the Exponential Moving Average (EMA), you need one additional observation compared to the Simple Moving Average (SMA). Let’s say you decide to use 5 days as the number of observations for the EMA.
With the SMA, you have to wait until the 5th day to calculate it because you simply sum up the values of the past 5 days and divide by 5. So, it requires a full set of 5 observations.
However, with the EMA, things work a little differently. On the 6th day, you can use the SMA from the previous day (which was calculated using 5 observations) as the first EMA value for yesterday. This means you can start calculating the EMA one day earlier than the SMA.
The EMA is a moving average that gives more weight to recent observations, and it’s calculated using a formula that takes into account the previous EMA value and the current observation. This allows you to have a smoother and more responsive average compared to the SMA.
So, in summary, the EMA requires one additional observation because it considers the previous day’s EMA value, whereas the SMA only considers a fixed number of past observations.
By using EMA in your analysis, you can stay updated with the latest price changes and make faster trading decisions.
Weighted Moving Average (WMA):
While Simple Moving Averages (SMA) and Exponential Moving Averages (EMA) are widely used, Weighted Moving Averages (WMA) provide an additional level of flexibility by allowing you to assign custom weights to different prices based on specific criteria.
This customization enables a more personalized moving average calculation that aligns with your unique requirements. Let’s dive into the simple explanation, formula, calculation, and example to illustrate how WMA works.
In simple words, WMA gives you the ability to emphasize certain prices more than others when calculating the average. By assigning higher weights to prices you consider more important or relevant, you can reflect your specific analysis preferences.
Formula and Calculation:
The formula for calculating the Weighted Moving Average (WMA) involves multiplying each price by its assigned weight, summing the results, and dividing by the sum of the weights. Here’s the formula:
WMA = (P₁ * W₁ + P₂ * W₂ + … + Pₙ * Wₙ) / (W₁ + W₂ + … + Wₙ)

Where:
- P₁, P₂, …, Pₙ: Prices of the data points.
- W₁, W₂, …, Wₙ: Weights assigned to each price.
To calculate WMA, follow these steps:
- Determine the number of data points (n) and assign weights (W₁, W₂, …, Wₙ) to each price.
- Multiply each price (P₁, P₂, …, Pₙ) by its corresponding weight.
- Sum the results of the multiplications.
- Sum the weights.
- Divide the sum of the weighted prices by the sum of the weights to obtain the WMA.
Example:
Let’s say we have a 5-day dataset of closing prices for a stock: $10, $12, $11, $15, and $14. We want to calculate a 5-day Weighted Moving Average with custom weights assigned based on our preference.
For this example, let’s assign weights of 1, 2, 3, 4, and 5 to the respective prices (in chronological order). Using the WMA formula, we can calculate the WMA as follows:
WMA = ($10 * 1 + $12 * 2 + $11 * 3 + $15 * 4 + $14 * 5) / (1 + 2 + 3 + 4 + 5)

= ($10 + $24 + $33 + $60 + $70) / 15
= $197 / 15
= $13.13 (rounded to two decimal places)
Therefore, the 5-day Weighted Moving Average (WMA) for the given dataset with the custom weights assigned is $13.13.
By assigning different weights to each price, you can tailor the WMA calculation to reflect your analysis preferences and give more weightage to prices you consider more significant. This flexibility allows for a personalized moving average that aligns with your specific criteria and trading or investment strategy.
SMA vs. EMA vs. WMA
| Type of Moving Average | Description | Weighting | Responsiveness | Sensitivity to Recent Data |
|---|---|---|---|---|
| Simple Moving Average (SMA) | Calculates average over a fixed time period. | Equal weight to all data points | Less responsive to recent data | Low |
| Exponential Moving Average (EMA) | Emphasizes recent data points. | Exponential weighting | More responsive to recent data | High |
| Weighted Moving Average (WMA) | Assigns custom weights to data points. | Varies based on assigned weights | Varies based on assigned weights | Varies based on weights |
Benefits of using Moving Averages
Here are some key advantages:
Trend Identification: Moving averages help to identify the direction of a trend. By observing whether the moving average is sloping upward or downward, traders can determine whether the underlying asset’s price is in an uptrend, downtrend, or sideways movement.
Smoothing Volatility: Moving averages smooth out price fluctuations and noise in data, making it easier to identify the underlying trend. This can be especially helpful in volatile markets where prices can swing dramatically.
Support and Resistance Levels: Moving averages often act as support (lower bound) or resistance (upper bound) levels. Traders use these levels to make decisions about buying, selling, or holding positions.
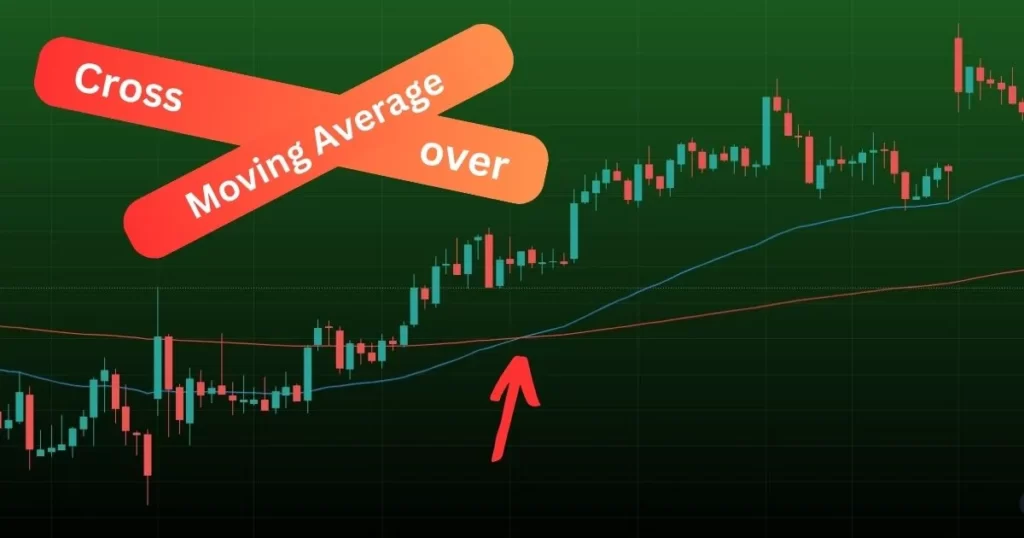
Entry and Exit Points: Crossovers between different moving averages or between a moving average and the asset’s price can signal potential entry or exit points for trades. For instance, a short-term moving average crossing above a long-term moving average might indicate a bullish signal.
Confirmation of Trends: Moving averages can confirm the strength of a trend. When an asset’s price remains consistently above a moving average, it can suggest a strong uptrend, while staying below could suggest a strong downtrend.
Market Sentiment: Traders often use moving averages to gauge market sentiment. A widely followed moving average acting as support or resistance can influence the behavior of traders, affecting market sentiment.
Risk Management: Moving averages help traders set stop-loss levels. By placing stop-loss orders slightly below a moving average, traders can limit potential losses if the trend reverses.
Long-term Investment Strategies: Investors use moving averages to make long-term investment decisions. For instance, a “buy-and-hold” strategy might involve purchasing a stock when its price is above a certain moving average and selling when it falls below.
Limitations of Moving Averages
Lagging Indicator: Moving averages inherently lag behind current prices, which can result in delayed signals. This lag can cause traders to miss out on rapid price changes or enter/exit positions too late.
Whipsaw Effect: In choppy or sideways markets, moving averages can generate false signals due to frequent crossovers. Traders may experience losses when prices fluctuate around the moving average without a clear trend.
Insensitive to Sudden Changes: Moving averages may not react swiftly to sudden and sharp price movements, such as news-driven events or market shocks. This can result in delayed responses to significant market shifts.
Not Suitable for Short-Term Volatility: Short-term moving averages can be heavily influenced by short-term price fluctuations, making them less reliable for volatile market conditions.
Backward-Looking: Moving averages solely rely on past price data, and they might not capture evolving market conditions or unexpected events.
Not a Standalone Tool: Relying solely on moving averages might not provide a comprehensive view of the market. They are more effective when used in conjunction with other technical and fundamental analysis tools.
Bottom line:
Overall, moving averages help traders and investors get a better understanding of price trends, making it easier to make informed decisions about buying, selling, or holding assets.
FAQs: Moving Averages
Q1: What is a moving average?
A moving average is a mathematical tool used in the stock market to smooth out fluctuations in stock prices. It calculates the average price of a stock over a specific period, which helps investors see the overall trend more clearly.
Q2: How does a moving average work?
A moving average works by taking the average of a set number of previous stock prices within a chosen time frame. As new prices come in, the oldest price is dropped, and the newest one is added, creating a “moving” average that adapts to changes over time.
Q3: What’s the purpose of using moving averages in the stock market?
Moving averages help investors identify trends and potential turning points in stock prices. They smooth out short-term volatility, making it easier to see the overall direction of a stock’s price movement.
Q4: What are the different types of moving averages?
1. Simple Moving Average (SMA),
2. Exponential Moving Average (EMA),
3. Smoothed Moving Average (SMMA),
4. Weighted Moving Average (WMA)
Q5: How can moving averages help in making investment decisions?
Moving averages provide insights into the general trend of a stock’s price movement. Investors often use crossovers between shorter and longer moving averages as signals for potential buy or sell opportunities.
Q6: What’s a “golden cross” and a “death cross”?
A “golden cross” occurs when a short-term moving average (like the 50-day SMA) crosses above a longer-term moving average (like the 200-day SMA), indicating a potential upward trend. Conversely, a “death cross” happens when the short-term moving average crosses below the long-term moving average, suggesting a possible downward trend.
Q7: Can moving averages predict stock prices accurately?
Moving averages are more about identifying trends than predicting exact prices. They can provide helpful signals, but they’re not foolproof predictors of future prices. Other factors and analyses should also be considered.
Q8: What are some drawbacks of using moving averages?
Moving averages might lag behind sudden price changes, and they can generate false signals during sideways markets. Additionally, relying solely on moving averages might overlook important fundamental and market-specific information.
Q9: Are moving averages useful for short-term or long-term trading?
Moving averages can be useful for both short-term and long-term trading strategies. Short-term traders might focus on shorter moving averages for quick trades, while long-term investors might use longer moving averages to capture broader trends.
Q10: Where can I find moving average data for stocks?
Most stock trading platforms and financial websites provide tools to plot and analyze moving averages. They can be applied to stock price charts to help you visualize and interpret the data.


