CAPM, or the Capital Asset Pricing Model, is widely used in finance to measure the relationship between risk and expected return.
Have you ever wondered why some investments carry higher risks yet deliver eye-popping returns? Or why a ‘safe’ stock might underperform even when the market is booming?
Whether you’re a finance student, an investor seeking insights, or a professional brushing up on the basics, this guide breaks down CAPM in simple terms, using examples and relatable concepts to keep things engaging.
What Is CAPM and Why Does It Matter?
At its core, the Capital Asset Pricing Model (CAPM) is a financial tool that helps to balance risk and reward.
It helps investors decide if an investment is worth the inherent risks, providing a structured way to evaluate returns relative to market volatility.
So, what’s the big idea? CAPM addresses this fundamental question: If I’m taking on more risk, how much extra return should I expect?
For investors, this isn’t just a nice-to-know—it’s crucial for making informed decisions in a world where higher returns usually come with higher risks.
The model gives a mathematical framework to weigh these trade-offs and helps determine whether an asset fits into a portfolio.
The CAPM Formula:
Here’s the CAPM formula, written as simply as possible:

Let’s break it down piece by piece:
- E(Ri) (Expected Return): This is what you hope to earn from the investment. It’s the target return you’re aiming for, based on the risks involved.
- Rf (Risk-Free Rate): Think of this as the baseline. It’s the return you’d get from an investment with virtually no risk—like U.S. Treasury bonds. While these returns are low, they’re considered “safe” and form the foundation of the formula.
- Beta (βi): This measures the investment’s sensitivity to overall market movements. A beta of 1 means the asset moves in sync with the market. A beta greater than 1 suggests more volatility, while a beta less than 1 indicates less risk relative to the market.
- E(Rm) (Expected Market Return): This is the average return you’d expect from the broader market, like an index fund tracking the S&P 500.
- (E(Rm) – Rf) (Market Risk Premium): This term represents the additional return the market offers over the risk-free rate. It’s the “extra” reward for taking on market risk.
How Does It All Fit Together?
In simple terms, CAPM says:
Risk-free return + Risk premium = Expected return
Here’s what happens under the hood:
- Start with the risk-free rate, your baseline return.
- Add the market risk premium, adjusted by the asset’s beta. This adjustment scales the market’s premium up or down based on how volatile (or safe) the asset is compared to the market.
Together, this gives you the expected return—the return you should demand to justify the risk of that specific investment.
If an asset’s actual return falls short of its CAPM-calculated expected return, it may not be worth the risk.
Conversely, if it exceeds the expected return, it could be a smart addition to your portfolio.
How Does CAPM Work?
Let’s See an Example
Imagine you’re evaluating a trendy tech stock. Here’s what you know:
- Risk-Free Rate (Rf): 2% (current Treasury bond yield).
- Market Return (E(Rm)): 8% (historical average market return).
- Beta (βi): 1.5 (this stock is 50% more volatile than the market).
Plugging these values into the CAPM formula:

The CAPM model suggests that for the risk you’re taking, you should expect an 11% return.
Now, let’s say analysts predict the stock will deliver a 9% return. According to CAPM, it’s underperforming relative to its risk, and you might want to look elsewhere.
However, if the predicted return were 13%, it would exceed the CAPM expectation, making it a potentially attractive investment.
Why Does CAPM Matter?
- Simplicity: CAPM distills complex investment decisions into a single, clear formula.
- Comparability: It provides a benchmark for comparing different investments.
- Risk Assessment: By focusing on beta and the market premium, CAPM emphasizes the relationship between market-wide risks and individual asset risks.
- Strategic Decision-Making: Investors and fund managers use CAPM to ensure their portfolios strike the right balance between risk and reward.
In essence, CAPM offers a framework for evaluating investments based on the fundamental principle of finance: greater risk demands greater return.
Whether you’re analyzing individual stocks, ETFs, or entire portfolios, this model can be a guiding star in the decision-making process.
Why Beta (β) Is a Big Deal
In the world of CAPM, beta (β) is the true showstopper. This magical little number tells us how an asset dances to the tune of the market’s rhythm.
It’s the ultimate gauge of market sensitivity, measuring how much an asset’s price swings compared to the broader market.
Whether you’re an adrenaline junkie or a cautious investor, beta helps you pick the right “ride” for your risk appetite.
What Beta Values Mean for Your Investments
Beta comes in different flavors, each with its implications for risk and return:
- β = 1: The asset moves in sync with the market. If the market gains 10%, this asset gains 10%; if the market drops 5%, so does the asset. Think of it as the dependable friend who always sticks to the group plan.
- β > 1: Now we’re talking about the thrill-seekers! These assets are more volatile than the market. A beta of 1.5 means the asset is 50% more sensitive to market changes—great when the market’s on an upswing, but not so fun during a downturn.
- β < 1: These assets are the calm amidst the storm. With less volatility than the market, they provide a smoother ride but may not deliver sky-high returns. A beta of 0.5, for example, means the asset only reacts to market changes by half a degree.
- β < 0: A rare breed, negative-beta assets move opposite to the market. These are like umbrellas during a rainstorm: they shine when the market struggles. Gold is often cited as a classic example.

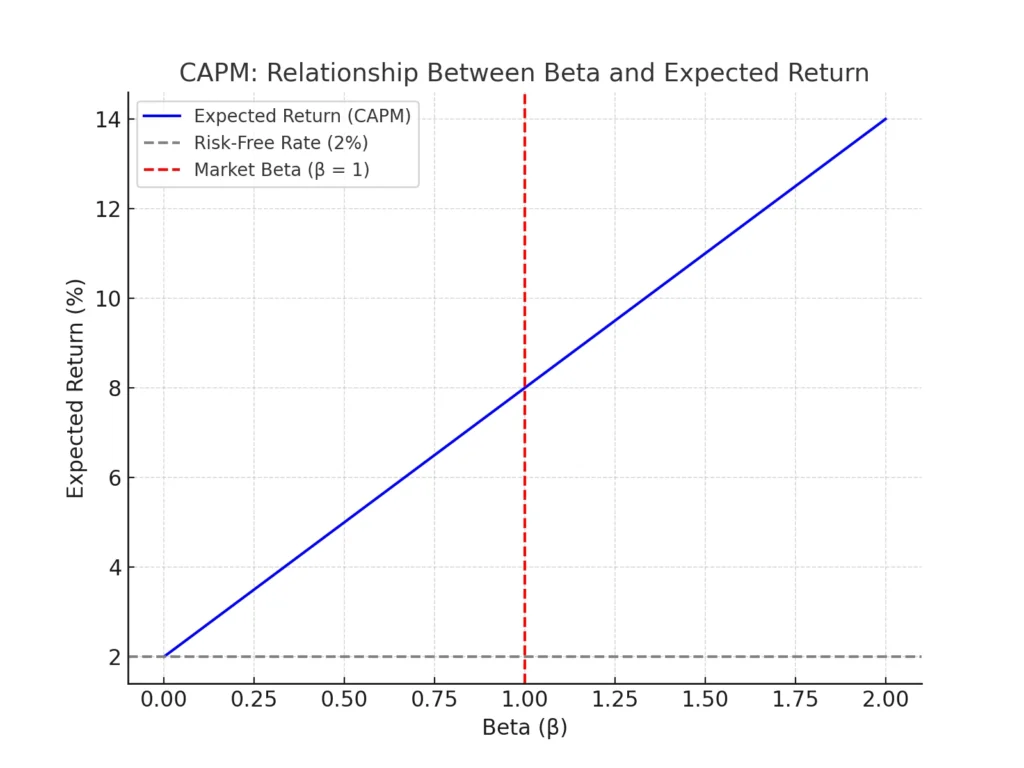
Here is a simple graph illustrating the relationship between Beta (β) and Expected Return according to the CAPM formula:
- The blue line represents how the expected return increases as Beta rises, assuming a risk-free rate of 2% and a market return of 8%.
- The dashed gray line marks the Risk-Free Rate (2%), showing the return you’d get without taking any risk.
- The red dashed line highlights Beta = 1, where the expected return equals the market return.
This visualization captures the essence of CAPM—a higher Beta means a higher expected return due to increased risk. Let me know if you’d like any tweaks or additional annotations!
CAPM: Limitations
The Capital Asset Pricing Model (CAPM) is a cornerstone of modern finance, widely respected for its simplicity and utility.
But like any tool, it’s not without its flaws. While CAPM can be incredibly helpful, it comes with some limitations that every investor should understand.
Let’s dive into the main criticisms and why they don’t necessarily make the model obsolete.
1. Simplistic Assumptions: Markets Aren’t Always Rational
CAPM assumes that markets are efficient and investors are rational—two ideas that sound great in theory but rarely hold up in real life.
In efficient markets, all available information is instantly reflected in asset prices, leaving no room for mispricing.
Investors, on the other hand, are presumed to make decisions based purely on logic, free from emotions like fear or greed.
But let’s be honest: markets can be chaotic. Investors panic during downturns, chase trends during rallies, and are swayed by everything from breaking news to social media hype.
Behavioral finance studies have repeatedly shown that human psychology plays a significant role in financial markets, challenging CAPM’s assumption of rationality.
Real-Life Example:
Think back to the GameStop frenzy of early 2021. Did the stock’s skyrocketing price reflect its intrinsic value?
Hardly. It was a classic case of market inefficiency driven by investor emotions and social media-fueled momentum.
2. Single Risk Factor:
Another key criticism of CAPM is its focus on just one risk factor—market risk (or systematic risk).
It assumes that all other risks can be diversified away, which is true to an extent but far from comprehensive.
Real-world investments face a variety of risks that CAPM doesn’t consider, such as:
- Liquidity Risk: Can you sell the asset quickly without affecting its price?
- Geopolitical Risk: How might political instability, wars, or policy changes impact your investment?
- Company-Specific Risk: What if a key product launch fails, or the company’s management makes poor decisions?
By ignoring these additional factors, CAPM simplifies a complex reality. While it’s a useful tool, relying on it exclusively could lead to blind spots in your analysis.
A Broader Perspective:
Other models, like the Fama-French Three-Factor Model, expand on CAPM by incorporating factors like company size and value versus growth characteristics. These models aim to address some of the nuances that CAPM leaves out.
3. Historical Data Bias: The Past Isn’t Always Prologue
CAPM relies heavily on historical data to estimate critical inputs like beta, expected market returns, and the risk-free rate.
The assumption is that past performance offers a reliable indicator of future trends. But as any seasoned investor knows, the market doesn’t always stick to the script.
Consider this: The risk-free rate might be based on today’s Treasury yields, which could be historically low or high.
Similarly, beta is calculated from past price movements, but a company’s future volatility could differ significantly due to new management, product launches, or economic shifts.
Why It Matters:
Relying on historical data can give a false sense of certainty. Just because a stock had a beta of 1.2 last year doesn’t mean it will behave the same way next year, especially if market conditions or the company’s fundamentals change.
So, Should You Still Use CAPM?
Absolutely—CAPM is still a valuable tool, especially when used as a starting point. Its simplicity and focus on systematic risk make it a great framework for evaluating investments.
However, it’s essential to pair it with other models and metrics to get a fuller picture of risk and return. Think of CAPM as the foundation of a house: solid, but not the entire structure.
By understanding its limitations, you can use CAPM wisely without falling into the trap of over-reliance.
After all, no single tool can capture the complexity of financial markets, and that’s part of what makes investing both challenging and exciting.
Practical Applications of CAPM: Why It’s Still Relevant
Despite its limitations, the Capital Asset Pricing Model (CAPM) remains a cornerstone of modern finance.
Its elegant simplicity and focus on the risk-return relationship make it a powerful tool in various areas of investing and financial decision-making. Let’s explore how CAPM is applied in the real world.
1. Portfolio Management: Building a Balanced Investment Strategy
Fund managers and investors use CAPM to assess whether an asset enhances a portfolio’s overall performance.
By estimating an asset’s expected return, CAPM helps determine whether the potential reward justifies the risk.
How It Works:
CAPM allows fund managers to:
- Compare the expected returns of multiple assets.
- Identify undervalued or overvalued securities based on their risk-adjusted returns.
- Construct portfolios that align with the client’s risk tolerance and return objectives.
Example:
Imagine a portfolio manager is deciding whether to include a high-beta tech stock in a portfolio.
Using CAPM, they calculate the stock’s expected return. If the calculated return meets or exceeds the client’s target, the stock might be included. If not, the manager may look for alternatives.
2. Corporate Finance: Calculating the Cost of Equity
In the corporate world, CAPM plays a vital role in determining a company’s cost of equity—the return shareholders expect for their investment.
This is a key input when evaluating potential projects or funding decisions.
How It’s Used:
- Investment Decisions: Companies compare the expected return on new projects to their cost of equity. If a project’s return exceeds the cost, it’s likely worth pursuing.
- Capital Budgeting: CAPM helps in calculating the weighted average cost of capital (WACC), which is critical for valuing long-term projects or acquisitions.
Example:
A company considering a new factory might calculate its cost of equity using CAPM. If the project’s forecasted returns exceed this benchmark, the project may be deemed viable.
3. Risk Assessment: Guiding Individual Investment Choices
For individual investors, CAPM serves as a guide to understanding whether a particular investment aligns with their risk tolerance and return expectations.
By comparing the expected return of an asset to its CAPM-calculated return, investors can make more informed decisions.
How It Helps:
- Risk vs. Reward: Investors can assess if they’re being adequately compensated for taking on risk.
- Comparing Investments: CAPM provides a common framework for evaluating diverse assets, making it easier to spot opportunities or avoid potential pitfalls.
Example:
Suppose you’re considering investing in a renewable energy stock with a beta of 1.3. Using CAPM, you calculate that the stock should deliver a 10% return to justify its risk.
If analysts project only an 8% return, you might reconsider and look for better opportunities.
Beyond Theory: CAPM’s Real-World Value
While CAPM may not capture every nuance of the financial markets, its applications extend far beyond classroom exercises. It’s a practical, adaptable tool for a wide range of users:
- Fund Managers: For building diversified portfolios.
- Corporate Executives: For making strategic investment and funding decisions.
- Everyday Investors: For evaluating risks and returns before committing capital.
By leveraging CAPM thoughtfully and combining it with other tools and insights, investors and companies alike can make more confident and data-driven decisions.
After all, in a world of uncertainty, having a clear framework like CAPM can be a game-changer.
Common Questions About CAPM
Is CAPM Only for Stocks?
Not at all! CAPM can be applied to any investment, from bonds to real estate, as long as you can estimate beta and returns.
How Accurate Is CAPM?
While it provides a good starting point, CAPM is more of a guide than a crystal ball. Combining it with other models (like the Fama-French Three-Factor Model) can improve accuracy.
The Bottom Line:
The Capital Asset Pricing Model (CAPM) is a valuable tool for assessing risk versus reward when making investment decisions. It may not be perfect, but it helps build intuition about financial markets.
So the next time someone talks about balancing risk and return, you’ll know exactly what they mean—and you can confidently chime in with your understanding of CAPM. After all, isn’t finance just a roller coaster we’re all trying to ride smarter?


