The Relative Strength Index (RSI) is calculated using a formula that compares the average gains and losses of an asset over a set period of time.
Typically, traders use a 14-day period, but this can be adjusted depending on your trading strategy.
Let’s break down the formula and walk through an easy example to understand how it works.
Relative Strength Index(RSI) Formula
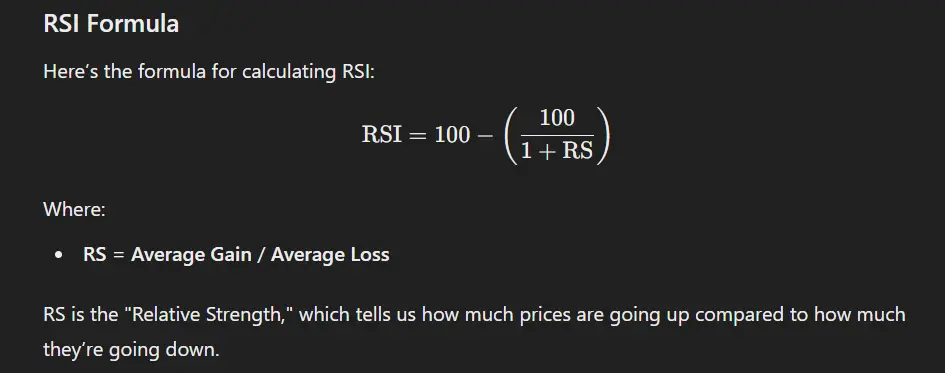
Here’s the formula for calculating RSI:
RSI=100−(100/1+RS)
Where:
- RS = Average Gain / Average Loss
RS is the “Relative Strength,” which tells us how much prices are going up compared to how much they’re going down.

Step-by-Step RSI Calculation
To make this easier to understand, let’s go through the steps using a simple example.
1. Choose a Time Period
- Let’s use a 14-day time period, which is the default for most RSI calculations.
2. Calculate the Gains and Losses
- Look at the closing prices for the last 14 days.
- Separate the days when the price went up (gains) and when it went down (losses).
Example:
| Day | Closing Price | Gain | Loss |
|---|---|---|---|
| 1 | 100 | ||
| 2 | 102 | +2 | 0 |
| 3 | 101 | 0 | -1 |
| 4 | 103 | +2 | 0 |
| 5 | 104 | +1 | 0 |
| 6 | 105 | +1 | 0 |
| 7 | 104 | 0 | -1 |
| 8 | 106 | +2 | 0 |
| 9 | 108 | +2 | 0 |
| 10 | 107 | 0 | -1 |
| 11 | 109 | +2 | 0 |
| 12 | 110 | +1 | 0 |
| 13 | 111 | +1 | 0 |
| 14 | 112 | +1 | 0 |
3. Calculate the Average Gain and Average Loss
- Adding all the gains(positive number) and dividing it by 14 (or the number of days if you are using a different period).
- Adding all the losses(negative number) and divide it by 14.
Total Gain: 2 + 2 + 1 + 1 + 2 + 2 + 2 + 1 + 1 + 1 = 15
Average Gain: 15/14 = 1.07
Total Loss: 1 + 1 + 1 = 3
Average Loss: 3/14 = 0.21
4. Calculate the Relative Strength (RS)
- RS is simply the Average Gain divided by the Average Loss.
RS=Average Gain/Average Loss
=1.07/0.21=5.10
5. Calculate the RSI
- Now, put the value of RS into the RSI formula.
RSI=100−(100/1+5.10)
=100−(100/6.10)
RSI=100−16.39=83.61
What Does the RSI of 83.61 Mean?
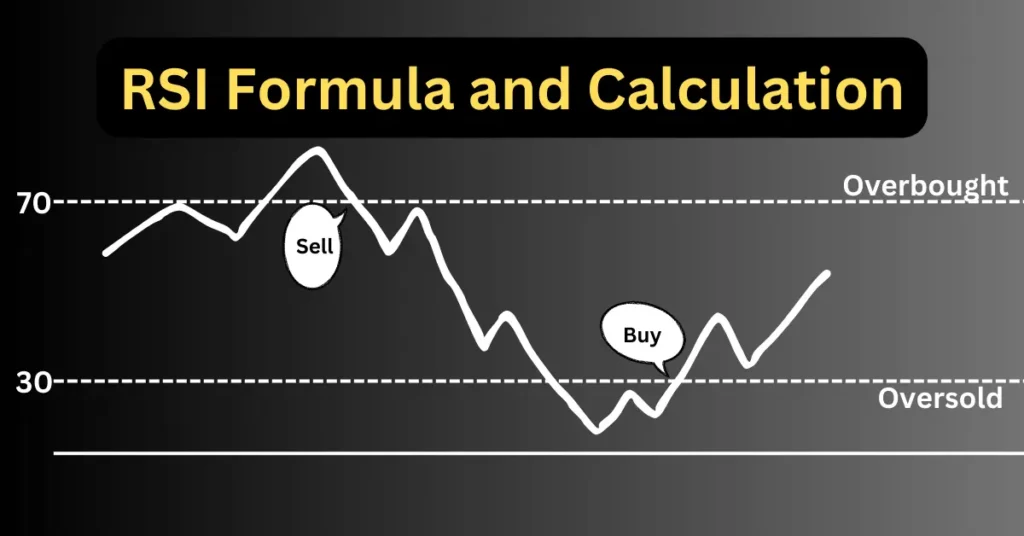
In this example, the RSI is 83.61, which is above 70. This means the stock or asset is overbought, and traders might expect a price drop or correction soon.
but this is just a probability and not a rule that the stock may drop, it may stay above 70 rsi value for a longer duration if the stock has strength.
Summary of Steps:
- Find the gains and losses for each day.
- Calculate the Average Gain and Average Loss over the time period.
- Find the Relative Strength (RS) by dividing the Average Gain by the Average Loss.
- Use the RSI formula to calculate the final RSI number.
The RSI helps you see if an asset is potentially overbought (above 70) or oversold (below 30), making it a useful tool for timing your trades.


