What is the Relative Strength Index (RSI)?
The Relative Strength Index (RSI) is a technical analysis tool many traders and investors use to understand how a stock or asset is performing.
This means that RSI shows how strong or weak momentum is present in the stock.
RSI indicator looks at past price movements to predict future trends. It helps you figure out if a stock is in the overbought or oversold zone, meaning it might be about to change direction.
RSI was developed by an American mechanical engineer named J. Welles Wilder Jr.
He Introduced this technical analysis tool in 1978 in his book New Concepts in Technical Trading Systems.
How Does RSI Work?
RSI is a momentum calculator that indicates the strength of speed and price change of a stock or any asset.
value of RSI oscillates between a scale from 0 to 100. It tells you how strong or weak a stock’s recent price movements are.
Here’s how it breaks down:
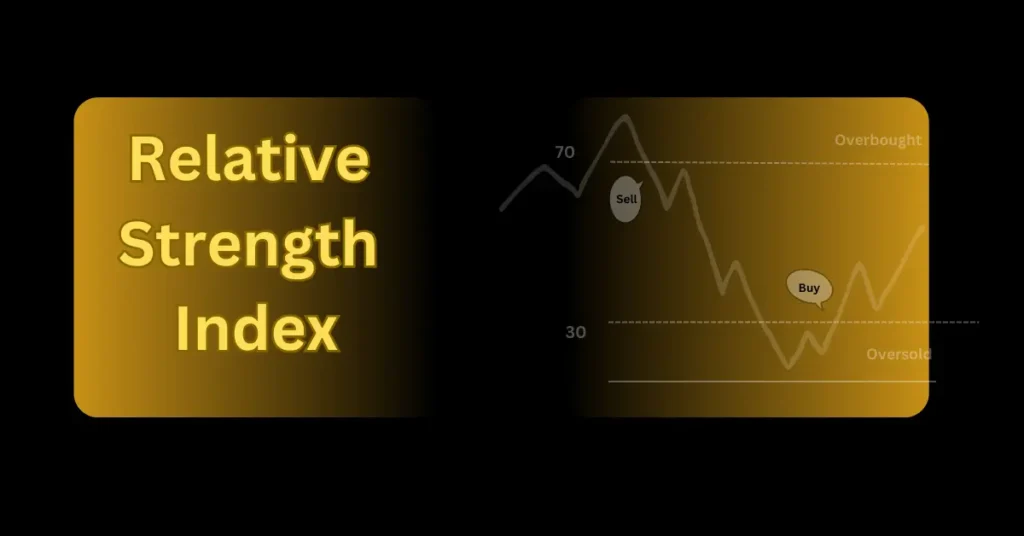
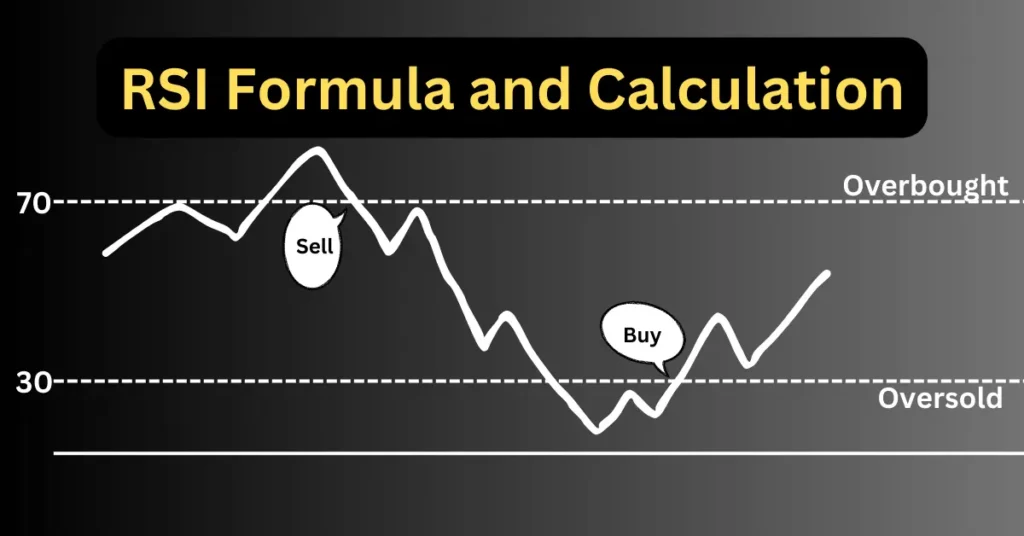
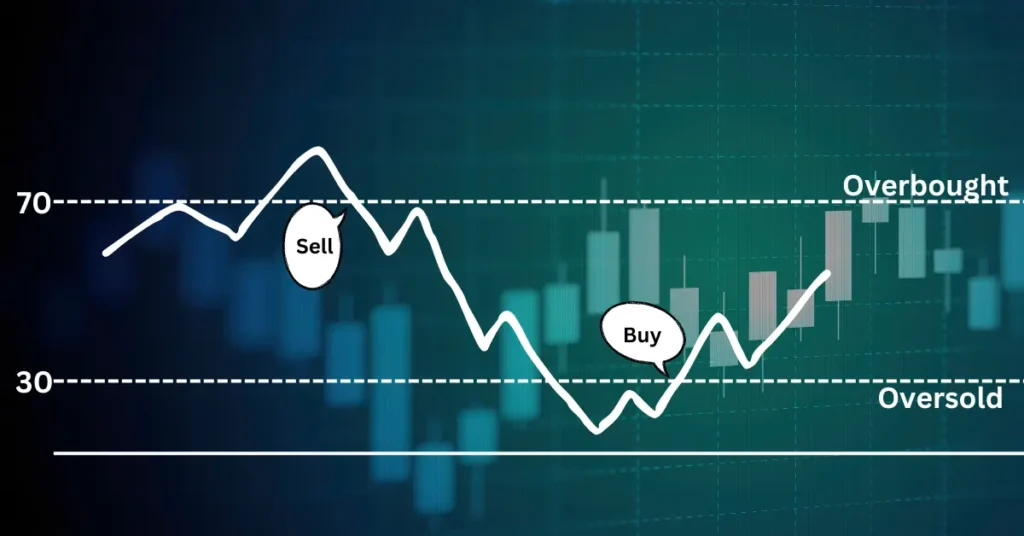
- Above 70: This is the overbought zone. This means that the stock price has been rising quickly, and it might be time for a drop.
- Below 30: This is the oversold zone. The stock price has been falling fast, and it might be due for a bounce back.
- Between 30 and 70: This is considered a neutral zone where the stock is moving normally without any extremes.
Also, Read | How is Relative Strength Index(RSI) Calculated? (with Formula and Simple Example)
Why is RSI Important?
RSI gives traders a quick snapshot of whether a stock might be changing its trend.
By showing whether a stock is overbought or oversold, RSI helps traders decide whether to buy or sell.
- If a stock is overbought (RSI above 70), it may have gone up too quickly. This is often a signal that it might fall soon, and traders may consider selling.
- If a stock is oversold (RSI below 30), it might have dropped too fast. This can be a signal that the price is about to rise, making it a good time to buy.
what is RSI divergence?
RSI divergence is a concept in technical analysis that traders use to spot potential reversals in a stock or asset’s price.
It involves comparing the movement of the price with the movement of the Relative Strength Index (RSI), which is an indicator that measures the strength of recent price changes.
There are 2 types of RSI divergence: bullish and bearish.
- Bullish divergence occurs if the price of an asset is decreasing, but the value of RSI is increasing.
This suggests that even though the price is falling, the momentum of selling pressure is weakening, so the price might soon reverse and head upwards.
- Bearish divergence, on the other hand, occurs when the price rises, but the RSI value is reducing.
This indicates that although the price is rising, the buying pressure is fading, which hints that the price might be due for a drop.
Traders use RSI divergence as a signal to watch out for potential trend reversals, but like any indicator, it’s not perfect. It works best when combined with other technical tools and analysis.
How to Use RSI in Trading
Using RSI is simple. Here are a few tips:
- Look for Overbought or Oversold Levels: When RSI moves above 70 or below 30, it’s a sign that a stock might reverse its trend. For example, a stock with an RSI of 75 might be due for a price drop, while one with an RSI of 25 might soon bounce back.
- Check for Divergences: Sometimes, the stock price and the RSI oscillator move in opposite directions. For example, if the stock price is rising, but the RSI is falling, this could be a sign that the uptrend is losing strength and might reverse soon.
- Combine RSI with Other Indicators: Don’t rely on RSI alone. It works best when combined with other technical indicators, such as Moving Averages or Bollinger Bands. These other indicators can be used to increase the chances of being right on the trading decision.
RSI Example
In any technical chart software like Trading View, you can find the ‘Relative Strength Index’ indicator.
once you select the indicator it will show on the chart as shown below.
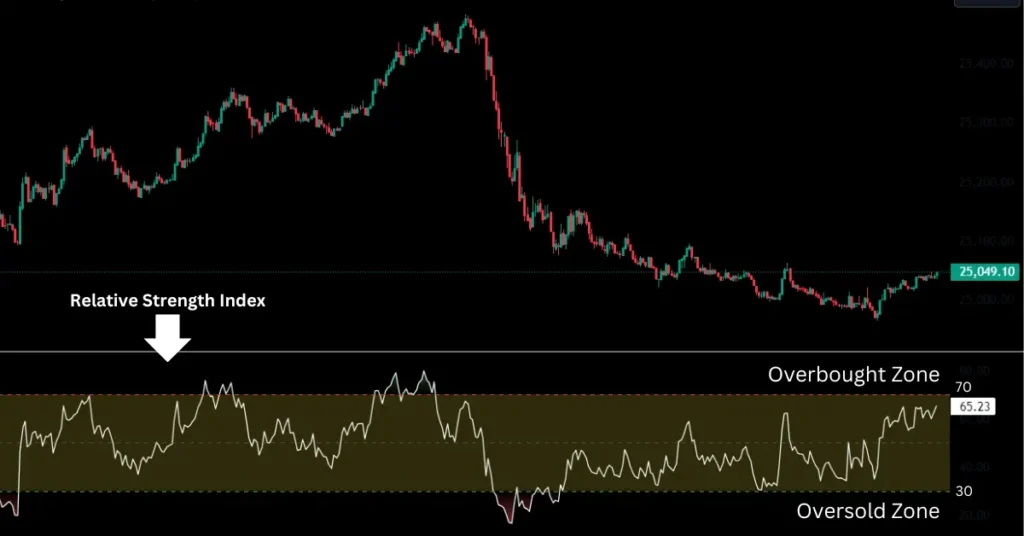
From the above chart, you can see that whenever the RSI reaches near 30(oversold zone) after some time it starts going up, and as it reaches 70 (overbought zone) it falls.
But this is also clear from the chart above that the price can remain for a longer duration in an overbought or oversold zone.
Benefits of Using RSI
- Simple and Quick: RSI is easy to calculate and understand, making it a great tool for beginners and experienced traders alike.
- Versatile: RSI can be used for stocks, commodities, forex, or any other tradable asset.
- Helps Avoid Emotional Decisions: By providing clear buy and sell signals, RSI helps traders avoid impulsive decisions based on fear or greed.
RSI Limitations
RSI is a powerful tool, but it’s not errorproof, sometime it may misguide that’s why we must use other technical analysis tools to increase the chances of being right.
- False Signals: Sometimes, the RSI may show that a stock is overbought or oversold, but the price doesn’t change as expected. This is why it’s important to consider other analysis tools or understand chart patterns while using RSI.
- Not Suitable for All Markets: In trending markets (where prices are moving steadily in one direction), RSI can give misleading signals. For example, in a strong uptrend, a stock may remain overbought for a long time without dropping in price.
Bottom Line
The Relative Strength Index (RSI) is a powerful momentum calculator tool for traders and Investors in finding the potential buying and selling opportunities.
It helps by indicating whether a stock is overbought or oversold, but it works best when used with other technical analysis tools.
By understanding and using the RSI, you can gain better insights into the market and make more informed trades.

