Share Market Insider

3 types of Moving Averages, their Formula and Calculations

Moving Averages

Understanding the Importance of Moving Averages In today’s dynamic financial market, data analysis is crucial in making informed trading and investment decisions. One powerful tool that traders and investors rely on is moving averages. Moving averages provide valuable insights into market trends, support and resistance levels, price crossovers, and volatility. In this blog post, we … Read more
What is the Relative Strength Index (RSI)? and how it works?

Relative Strength Index

What is the Relative Strength Index (RSI)? The Relative Strength Index (RSI) is a technical analysis tool many traders and investors use to understand how a stock or asset is performing. This means that RSI shows how strong or weak momentum is present in the stock. RSI indicator looks at past price movements to predict … Read more

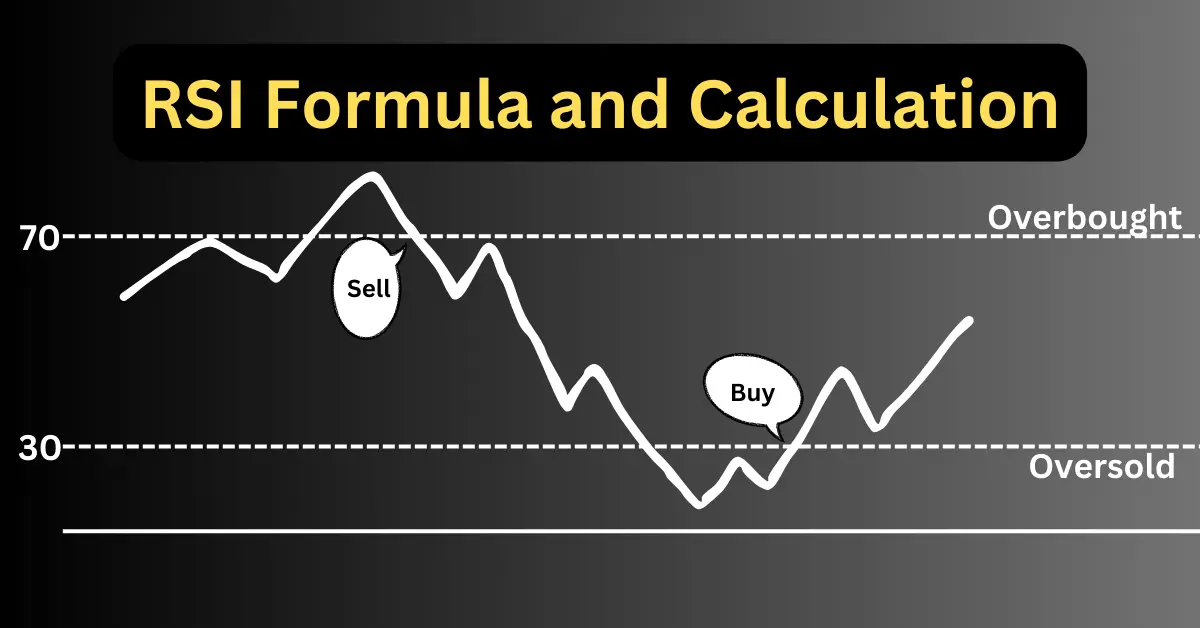
How is Relative Strength Index(RSI) Calculated? (with Formula and Simple Example)

RSI Formula and Calculation

The Relative Strength Index (RSI) is calculated using a formula that compares the average gains and losses of an asset over a set period of time. Typically, traders use a 14-day period, but this can be adjusted depending on your trading strategy. Let’s break down the formula and walk through an easy example to understand … Read more

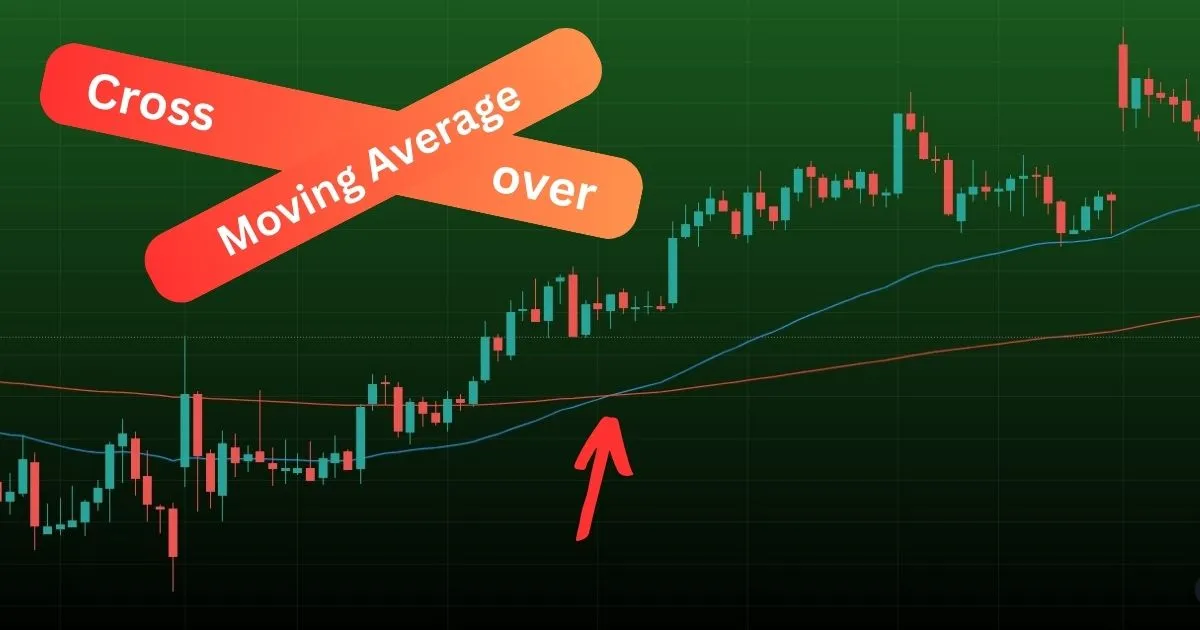
Moving Average Crossovers Can Double Your Trading Success

Moving Average Crossover

Moving Average Crossover is one of the methods used in technical analysis, Which has the potential to enhance your trading and investment journey by proper use. When we talk about the share market, where markets are influenced by a multitude of factors, traders, and investors are constantly seeking reliable strategies to make informed decisions. In … Read more