Technical analysis tools are an essential part of trading, and one such tool that has gained immense popularity among traders worldwide is Fibonacci retracement.
Price action trading with the Fibonacci retracement tool is a very effective combination and a part of a successful price action trading strategy.
This tool is based on the mathematical ratios discovered by an Italian mathematician named Leonardo Fibonacci, and it is used to identify potential support and resistance levels in financial markets.
Here we will discuss the importance of the Fibonacci retracement tool in trading and how it works.
What is Fibonacci Retracement?
Fibonacci retracement is a technical analysis tool mostly used in price action trading.
It uses horizontal lines to indicate areas of support or resistance at the key Fibonacci levels before the price continues in the primary direction.

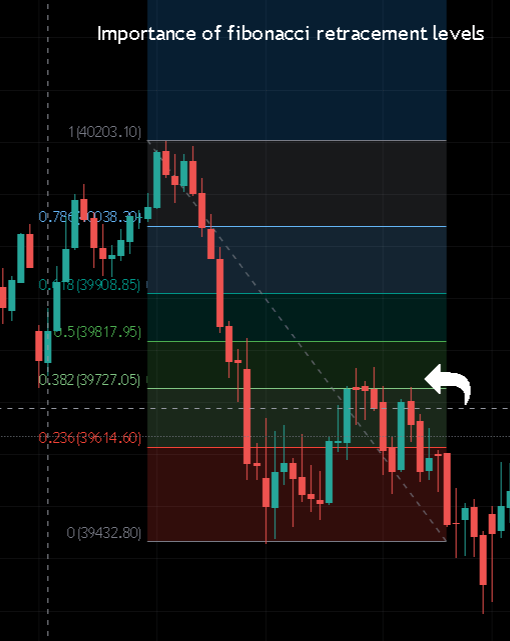
These levels can be found by connecting the recent high and recent low points of a price chart in a desired time frame and these Fibonacci ratios of 23.6%, 38.2%, 50%, 61.8%, 78.6%, and 100% occur on the chart.
These ratios are based on the Fibonacci sequence, a series of numbers where each is the sum of the two preceding numbers.
Here it is, the Fibonacci sequence starts with 0 and 1 and continues indefinitely as follows: 0, 1, 1, 2, 3, 5, 8, 13, 21, 34, 55, 89, 144, 233, 377, 610, 987, 1597, 2584, 4181, and so on.

How Fibonacci Retracement Works in Trading
The Fibonacci Retracement tool is used by traders to identify potential buy or sell zones based on the Fibonacci levels.
This is achieved by plotting the Fibonacci levels on a price chart and waiting for the price to reach these levels before taking a trade.
once the price reaches these (23.6%, 38.2%, 50%, 61.8%, 78.6%, and 100%) we don’t just buy or sell, instead, we have to wait for confirmation whether the price will continue its primary trend or break these levels.
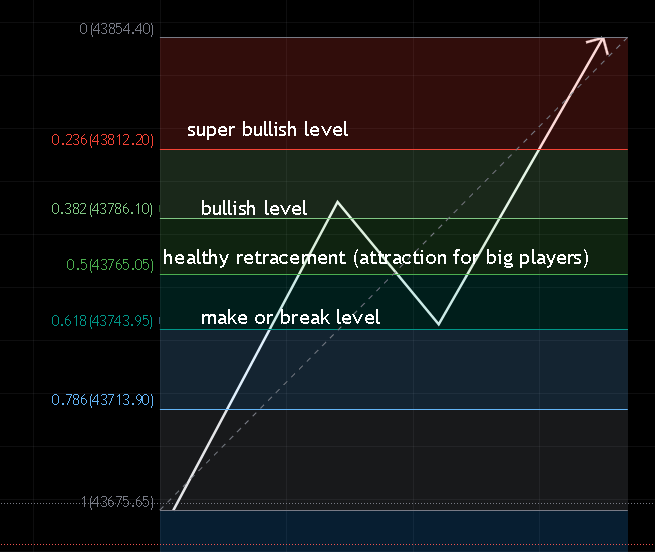
Each level has its importance. See in the picture-

You can see how to act at each level according to your trading plan while maintaining your Risk-to-Reward Ratio.
To use the Fibonacci retracement tool in trading, traders first need to identify the recent high and recent low points of a price chart.
These points are used to draw the Fibonacci retracement levels on the chart. The retracement levels are then used to identify potential support and resistance levels at which the price may find support or resistance as shown in the above picture.
Watch – Understand Fibonacci
By applying the Fibonacci ratios, the Fibonacci retracement levels are determined by multiplying the disparity between the high and low points of a price chart.
For example, the 38.2% retracement level is calculated by multiplying the difference between the high and low points by 0.382.
Once the Fibonacci retracement levels have been plotted on the chart, traders wait for the price to reach these levels before making a trading decision.
If the price reaches a Fibonacci retracement level and shows signs of bouncing off it, traders may interpret this as a potential support or resistance level.
Now the question comes to mind of how to be sure whether prices will continue or reverse at these levels, For this you need to understand the candlestick behavior and price action patterns. Here you can learn by reading these articles.
Recommended – Most Profitable Chart Patterns for trading
Traders one thing to remember here is that the Fibonacci retracement tool effectively works only in trending markets.
So in an uptrend mark this tool from bottom to top and in a downtrend mark top to bottom.
Here top and bottom mean recent highs and lows.
Benefits of the Fibonacci Retracement Tool
The Fibonacci retracement tool is highly beneficial for traders. It helps to identify potential entry and exit points for trades based on historical price movements.
Traders can use this tool to set stop-loss levels and take-profit levels based on the Fibonacci levels.
Additionally, it helps to confirm the direction of the trend and identify potential reversal points.
The Fibonacci retracement tool is mainly used by price action traders to support their trade confirmation.
Using Fibonacci retracement and trendline support in price action trading makes it a profitable strategy used by many price action traders.
The Fibonacci retracement tool can also help to confirm the direction of the trend and identify potential reversal points.
Traders can use the Fibonacci levels to confirm the direction of the trend by identifying key levels of support or resistance.
Additionally, they can use the tool to identify potential reversal points by looking for price bounces or breaks at key Fibonacci levels.
If the price breaks through a key Fibonacci level, this may indicate a potential trend reversal.
Limitations of the Fibonacci Retracement Tool
While it can be useful, it’s important to be aware of its limitations:
Subjectivity: The placement of Fibonacci retracement levels is somewhat subjective. Different traders might choose slightly different swing highs and swing lows to draw the retracement levels, leading to variations in the identified levels.
Doesn’t Always Work in Trendless Markets: Fibonacci retracements are most effective in trending markets, where there is a clear directional movement.
In choppy or sideways markets, the tool might provide less reliable signals.
No Clear Rules for Placement: While the Fibonacci ratios are mathematically derived, there are no strict rules for placing the retracement levels.
Traders often have to rely on experience and judgment to decide which swing highs and lows to use.
Not Always Accurate in Volatile Markets: In highly volatile markets, price movements can overshoot or undershoot the Fibonacci levels, leading to false signals or missed opportunities.
Conclusion
The Fibonacci retracement tool is a powerful technical analysis tool used by traders worldwide to identify potential support and resistance levels in financial markets.
It helps traders identify entry and exit points for trades, set stop-loss and take-profit levels, confirm the direction of the trend, and identify reversal points.
Traders should, however, exercise caution when using the tool, as it is not foolproof and should always be used in conjunction with other technical analysis tools and market indicators.
By understanding how the Fibonacci retracement tool works and how to use it effectively, traders can improve their chances of success in the financial markets.
FAQs:
1. How Fibonacci retracement levels are calculated?
The Fibonacci retracement levels are calculated by multiplying the vertical distance between the swing high and swing low by the Fibonacci ratios (0.382, 0.500, 0.618) and then subtracting or adding these values to the swing high or low.
2. What are the common Fibonacci retracement ratios?
The most commonly used ratios are 38.2%, 50%, and 61.8%. Traders also sometimes use additional levels like 23.6% and 78.6%.
3. Is Fibonacci retracement always accurate?
No, it’s not foolproof. While it works well in trending markets, it’s not effective in all situations.
4. Can Fibonacci levels be applied to any market or timeframe?
Fibonacci retracement can be applied to various markets and timeframes, but its effectiveness might vary. It’s important to adapt the tool to the specific context.
5. Are there other Fibonacci tools?
Yes, besides retracement, traders use other Fibonacci tools like Fibonacci extensions and Fibonacci fans to project potential price targets and trendlines.


