Moving Average Crossover is one of the methods used in technical analysis, Which has the potential to enhance your trading and investment journey by proper use.
When we talk about the share market, where markets are influenced by a multitude of factors, traders, and investors are constantly seeking reliable strategies to make informed decisions.
In this blog post, we’ll learn about moving average crossovers, understand how they work, and explore their potential to enhance your trading and investment success.
Understanding Moving Average Crossovers
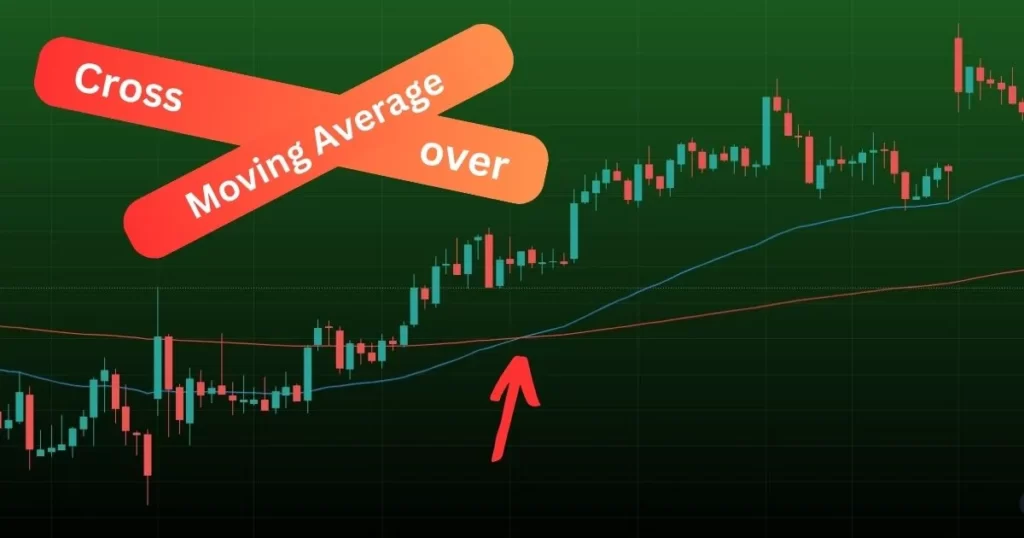
At its core, an MA crossover is a technical analysis technique that involves the comparison of two different moving averages – one with a shorter time and another with a longer time.
The goal is to identify potential shifts in market trends and signal to buy or sell opportunities.
The shorter moving average reacts more quickly to price changes, while the longer moving average provides a smoother and broader perspective of the trend.
When these two moving averages intersect, they generate signals that traders can interpret to make informed decisions.
Types of Moving Averages
Simple Moving Average (SMA):
This is the basic form of moving average calculation, which involves the simple average of closing prices over a defined period. It gives equal weight to each data point in the period.
Exponential Moving Average (EMA):
EMA places more emphasis on recent prices, making it more responsive to current market conditions. It assigns a higher weight to recent data points, making it suitable for short-term analysis.
Weighted Moving Average (WMA):
The Weighted Moving Average assigns varying weights to different data points within the chosen period.
Recent data points receive higher weights, enabling them to respond promptly to price shifts. WMAs strike a balance between SMA and EMA in terms of responsiveness.
Must, Read | Moving Averages- 3 Types, Formula, and Their Calculations
Using Crossover strategy for Trading
Golden Cross: A “Golden Cross” happens when the shorter-term moving average crosses above the longer-term moving average. This bullish signal indicates a potential upswing, suggesting a favorable time to buy.

Death Cross: Conversely, a “Death Cross” happens when the shorter-term moving average crosses below the longer-term moving average. This bearish signal points toward a possible downtrend, signifying a suitable moment to sell.

Benefits of Moving Average Intersection:
Simplicity:
Moving average crossovers are easy to understand and implement, making them suitable for both novice and experienced traders.
Trend Identification:
These crossovers provide a clear visual representation of trends, helping traders to identify potential market shifts.
Risk Management:
By using moving averages to confirm trends, traders can better manage risks associated with volatile markets.
Versatility:
Crossover strategy can be applied to various timeframes, making them adaptable for different trading styles.
Limitations of Moving Average Crossover Strategies
While moving average crossover strategies offer a straightforward and accessible approach to technical analysis in the financial markets, it’s important to recognize that no strategy is without its limitations.
1. Lagging Indicator:
One of the primary limitations of moving average crossover strategies is that they are lagging indicators.
Since moving averages are based on past price data, they might not capture rapid market movements or sudden price reversals in real-time.
This lag can result in delayed entry or exit points, causing traders to miss out on optimal trading opportunities.
2. False Signals:
Moving average crossovers can generate false signals, especially in ranging or choppy markets. Crossovers can occur frequently during such periods without indicating a clear trend direction.
This can lead to a series of small losses as traders respond to signals that don’t translate into profitable trades.
3. Whipsaw Effect:
The whipsaw effect refers to the phenomenon where a trader receives a signal to buy, followed shortly by a signal to sell, or vice versa, due to the rapid oscillation of prices around a moving average.
This can result in a series of unproductive trades and erode trading capital.
4. Not Suitable for Short-Term Scalping:
Moving average crossovers are generally better suited for identifying medium to long-term trends.
Short-term scalping strategies that aim to profit from small price movements within a single trading session might not find moving average crossovers as effective due to their lagging nature.
Tips for Effective Usage
Combine with Other Indicators: To increase accuracy, consider using moving average crossovers in conjunction with other technical indicators.
Adjust Timeframes: Experiment with different timeframes for moving averages to suit your trading strategy and the asset you’re analyzing.
Practice and Backtesting: Before applying moving average crossovers in live trading, practice on historical data to understand their effectiveness.
Bottom line
In the realm of investment strategies, moving average crossovers stand as a valuable tool for traders and investors seeking to make sense of market trends.
By interpreting these crossovers, you can gain insights into potential buying and selling opportunities, aiding in making informed decisions.
Remember, while Cross of moving averages can be highly effective, no strategy is foolproof.
Continuously refine your approach, adapt to changing market conditions, and combine insights from various sources to develop a well-rounded trading strategy.
Watch- Moving Average crossover strategy
FAQs: Moving Average Crossovers
1. What are moving average crossovers?
Moving average crossovers are a technical analysis technique used to identify potential shifts in market trends. They involve comparing two different moving averages – a shorter one and a longer one – to generate buy or sell signals based on the intersections of these moving averages.
2. How do moving average crossovers work?
Crossing averages work by tracking the movement of two moving averages with different timeframes. When the shorter moving average crosses above the longer moving average, it’s known as a “Golden Cross” and indicates a potential uptrend.
Conversely, when the shorter moving average crosses below the longer moving average, it’s called a “Death Cross,” suggesting a potential downtrend.
3. What is the difference between Simple Moving Averages (SMA) and Exponential Moving Averages (EMA)?
Simple Moving Averages (SMA) calculate the average of closing prices over a specific period with equal weight to each data point. Exponential Moving Averages (EMA), on the other hand, assign more weight to recent prices, making them more responsive to current market conditions.
4. What timeframes are commonly used for moving average crossovers?
Common timeframes for Moving average cross include combinations like 50-day and 200-day moving averages for longer-term trends, as well as 10-day and 20-day moving averages for shorter-term trends. However, the choice of timeframes depends on the trader’s preferred strategy and the asset being analyzed.
5. Can moving average crossovers be used for short-term trading?
While MA crossover signals are often associated with medium to long-term trends, they can be adapted for short-term trading with smaller timeframes. However, due to their lagging nature, they might not be as effective for very short-term scalping strategies.
6. Can I use moving average crossovers for investing as well as trading?
Yes, the Intersection of moving averages can be used for both investing and trading. Long-term investors can use them to identify potential entry or exit points, while short- to medium-term traders can utilize them for timely buy or sell decisions.
7. What is a 3-moving average crossover strategy?
A 3-moving average crossover strategy involves using three different moving averages with varying timeframes. When the shorter-term moving average crosses above the middle-term moving average, and the middle-term moving average crosses above the longer-term moving average, it generates a bullish signal. Conversely, when the opposite crossovers occur, it signals a bearish trend change.
8. Can I use moving average crossovers for intraday trading?
Yes, moving average crossovers can be adapted for intraday trading. Shorter timeframes, such as 5-minute or 15-minute charts, can help identify potential short-term trends. However, the lagging nature of moving averages might limit their effectiveness for very rapid intraday scalping.
9. What is the moving average crossover strategy success rate?
The moving average crossover strategy success rate varies based on market conditions and the trader’s skill. While they can be effective in trending markets, their accuracy can be compromised in ranging or choppy markets. Combining them with other indicators and proper risk management can enhance their success rate.
10. What is the best moving average crossover strategy?
There’s no universally “best” moving average crossover strategy, as effectiveness depends on various factors, including market conditions and the asset being traded. Commonly used combinations include the 50-day and 200-day moving averages for long-term trends, and the 10-day and 20-day moving averages for short-term trends. Traders often tailor strategies to their preferences and risk tolerance.


